Platform & SaaS · 2026
EChelper — multi-tenant analytics for Wildberries sellers
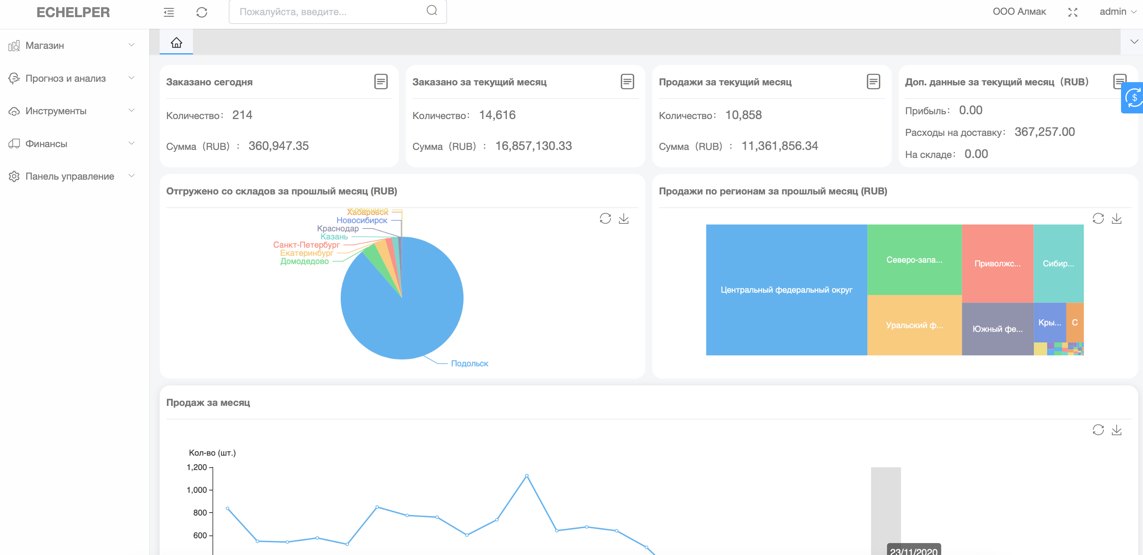
A multi-tenant analytics SaaS for Wildberries sellers: orders, returns, sell-through, stock, freight, demand forecast and slow-mover alerts, modelled on working-day, weekend and holiday day types rather than a generic time series.
The situation
The marketplace seller back office answers a narrow question: what happened to my orders. A merchant with several warehouses, several brands and a few thousand products needs a different question answered — what is happening, why, and what should I order for next month.
The data exists, but it arrives in four separate interfaces: purchase receipts, stock, orders and sales. Joining those feeds was a weekly spreadsheet exercise, and the joining rules lived in one operations person’s head. That is survivable for one merchant and impossible for a hundred, which is what made this a multi-tenant product problem rather than a reporting problem.
Multi-tenancy was not a preference. These are small and mid-sized merchants. A per-customer installation with a per-customer upgrade schedule is not a business that scales, and the merchants themselves do not want to run servers.
The call we made
Four judgments shaped the product, in order of consequence.
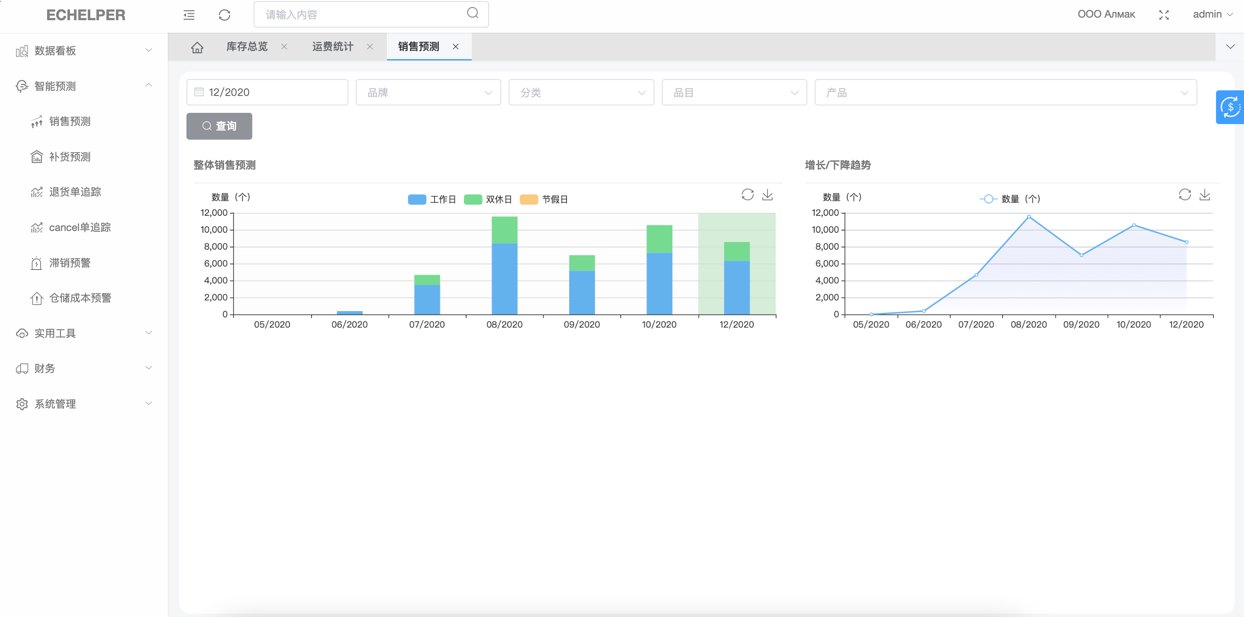
Model the calendar, not the series. The default answer to sales forecasting is a general time-series model. Two things ruled it out. The marketplace interface does not provide historical stock or seasonality data, so the inputs a seasonal model needs do not exist. And merchant volume in this market is dominated by day type — working days, weekends, and holiday blocks that move every year. So the forecast splits the target month into those three day types, takes the daily average for the same day type over the previous six months as the baseline, and multiplies by the number of days of each type in the target month. It is a smaller model than the one we could have written, and it is the one a merchant can check on a whiteboard. Seasonal correction is deliberately switched off, and the interface says so, because an unstated correction that cannot be fed is worse than no correction.
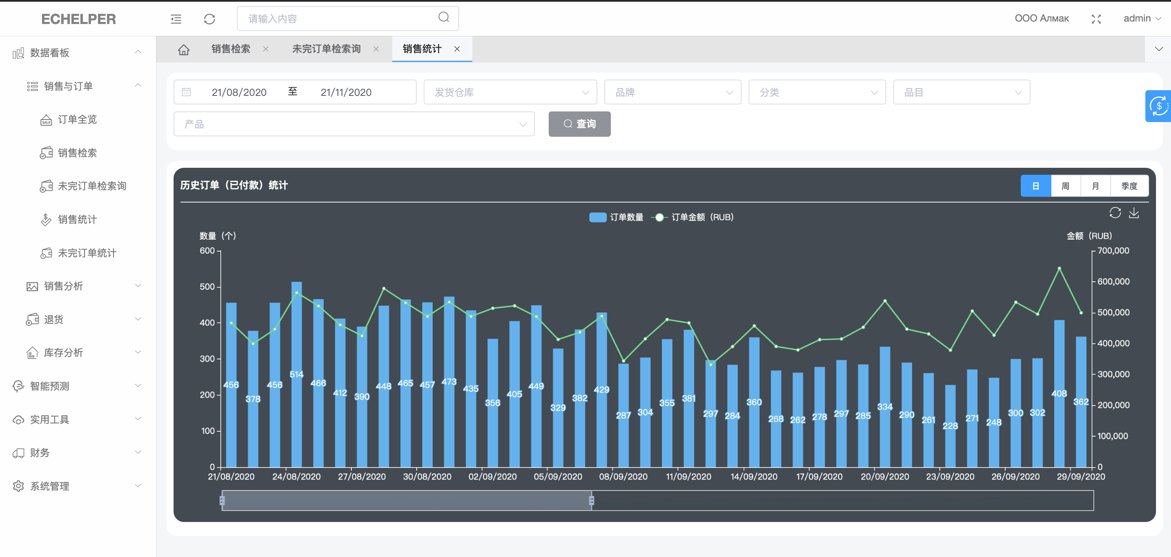
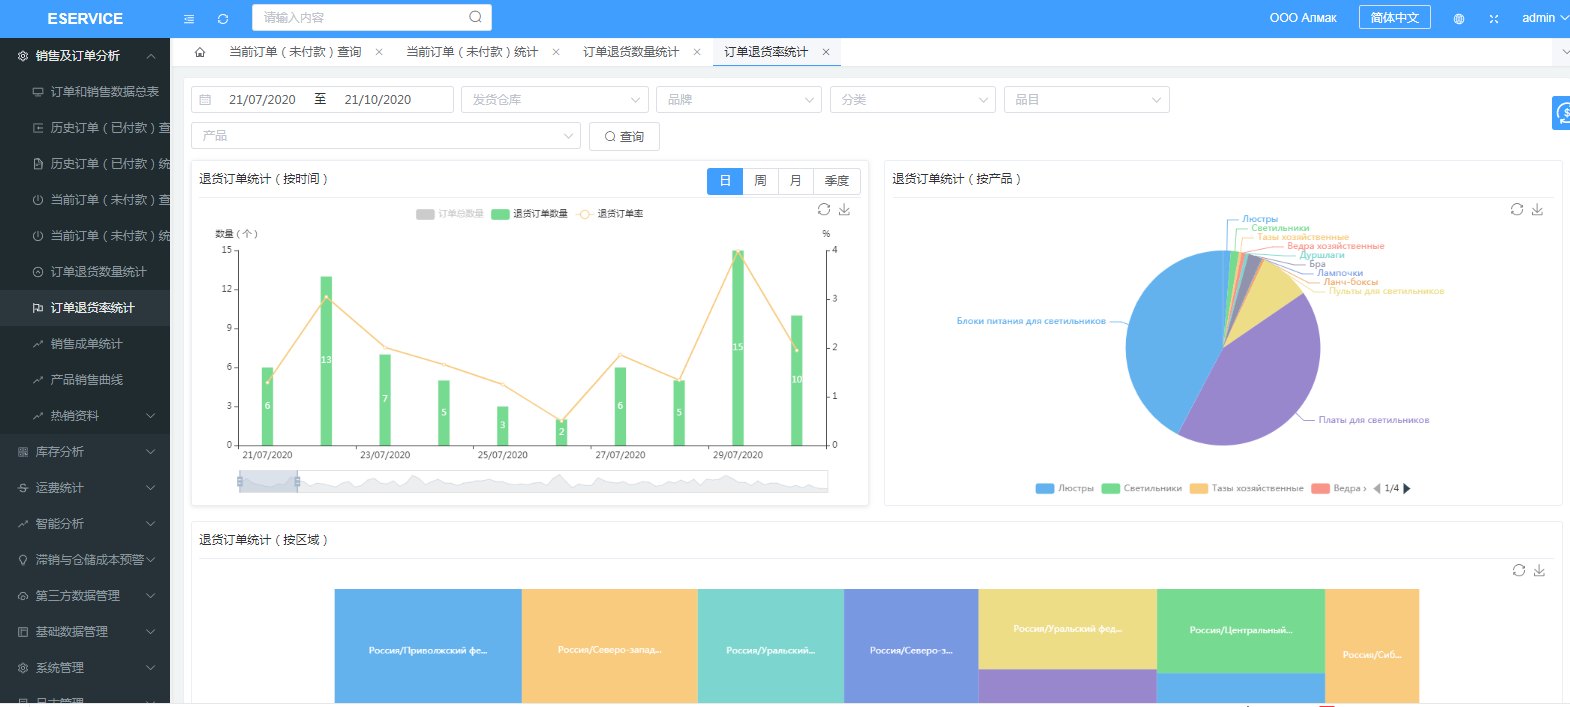
Separate the order basis from the sales basis. Orders and paid sales are different populations. Most tools merge them and then produce a number that reconciles with neither the platform back office nor the merchant’s bank account, after which nobody trusts the tool. We kept two statistics with two written definitions, and unpaid and cancelled orders get their own attribution view by region, warehouse and category instead of being folded into a completion rate. Selling a lot is not the same as selling well: return rate locates a quality problem, completion rate locates a listing or pricing problem, and the product lifecycle curve locates a stocking problem.
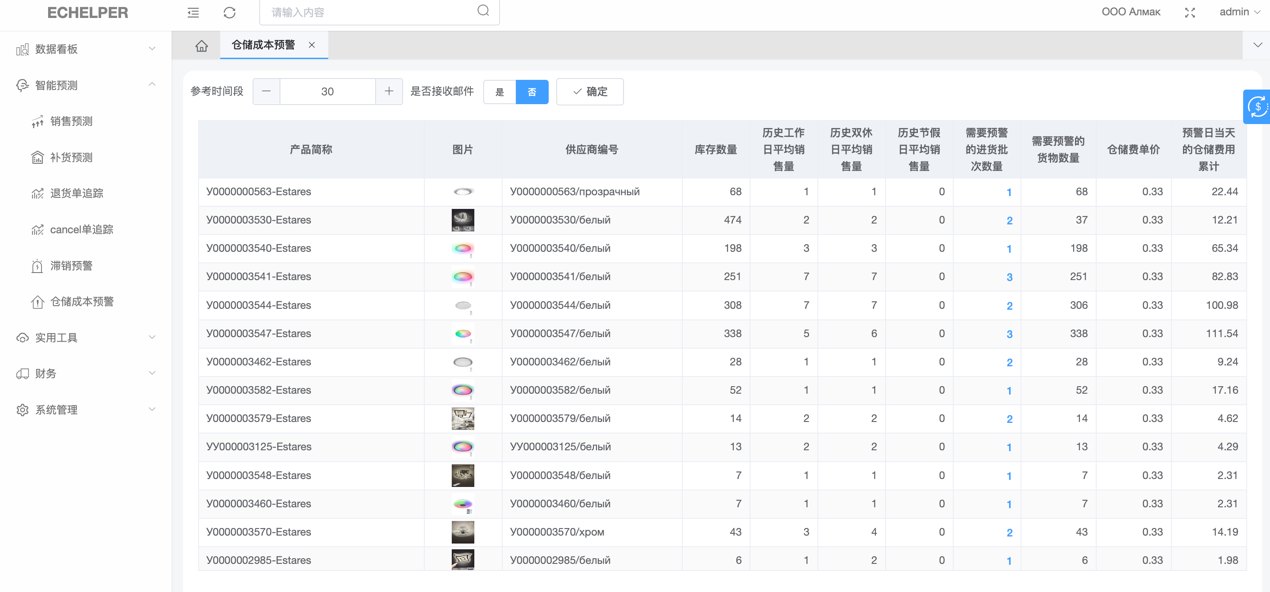
Push the warning to a person, not to a dashboard. Storage cost is a dated loss — the platform stores goods free for 60 days and then charges 0.33 roubles per item per day. A slow-mover alert sitting on a dashboard is only seen by someone who already suspected the problem. Both warnings compute nightly, compare the current period against the previous one in labelled bands (down 10 to 20 percent, 20 to 50, 50 to 70), and email the product list to the merchant. The alert must show its basis — baseline value, day type, drop band, and the storage cost projected under first-in-first-out consumption — or a merchant will not act on it.
Configuration over customisation, isolation from the first screen. Merchants differ in warehouses, brands, categories, currency and even in which days count as working days. All of it is tenant configuration. Each merchant reaches the system on its own subdomain and chooses a language at login, because tenancy that exists only inside the database is tenancy that leaks on the first screen. Smaller tenants share a database with a mandatory tenant predicate on every query; larger tenants get their own. One deployment, one upgrade, all tenants.
What we built
Six functional domains behind one filter set — brand, category, item, product, cascading, shared by every table and chart:
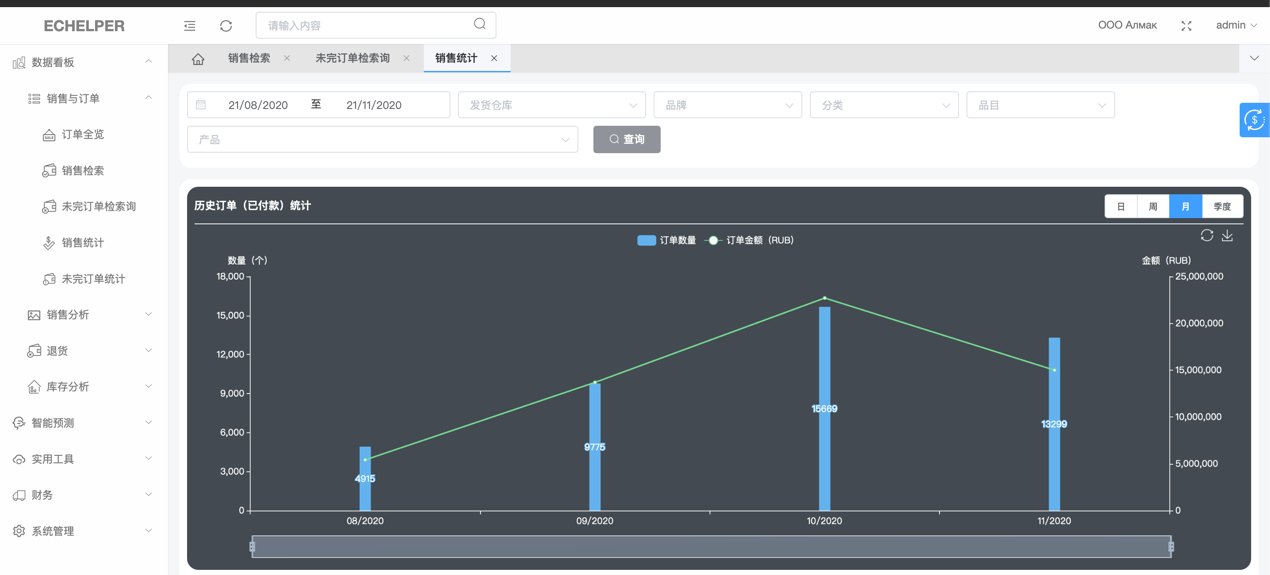
- Orders and sales. Order and sales master tables, paid and unpaid queries, grouped statistics by day, week, month and quarter, completion rate.
- Returns and loss. Return quantity and return rate, with R-order and cancel-order attribution by region, warehouse and category.
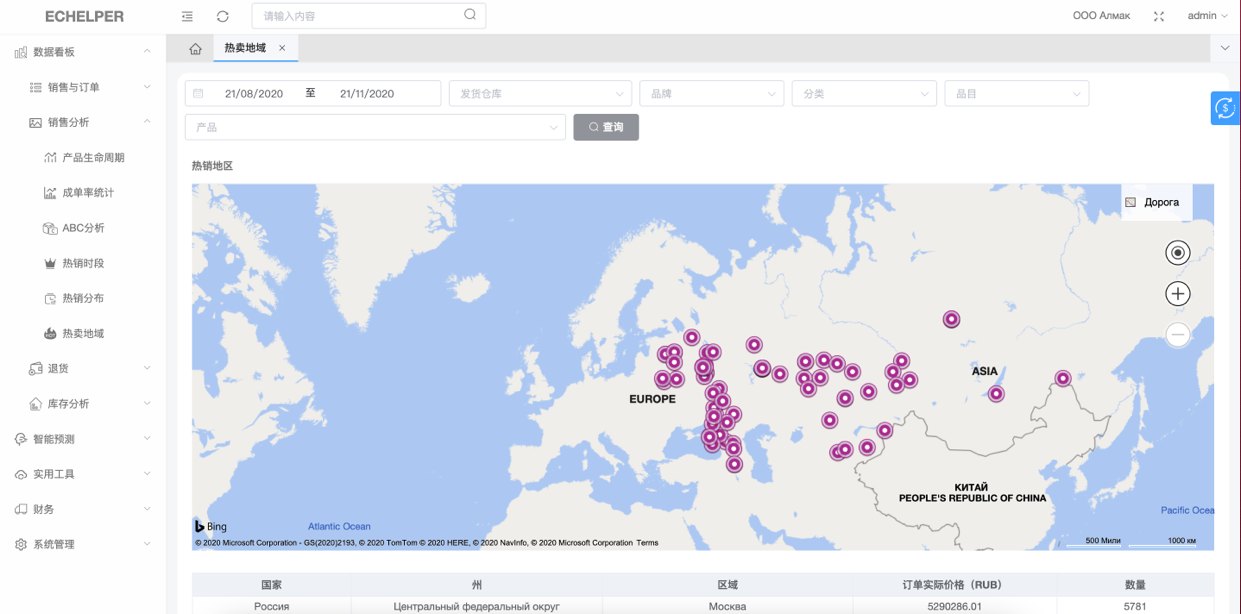
- Hot-selling profile. ABC on volume, revenue and margin; the day split into six four-hour bands; a calendar heat map for day-type patterns; a region map for warehouse placement.
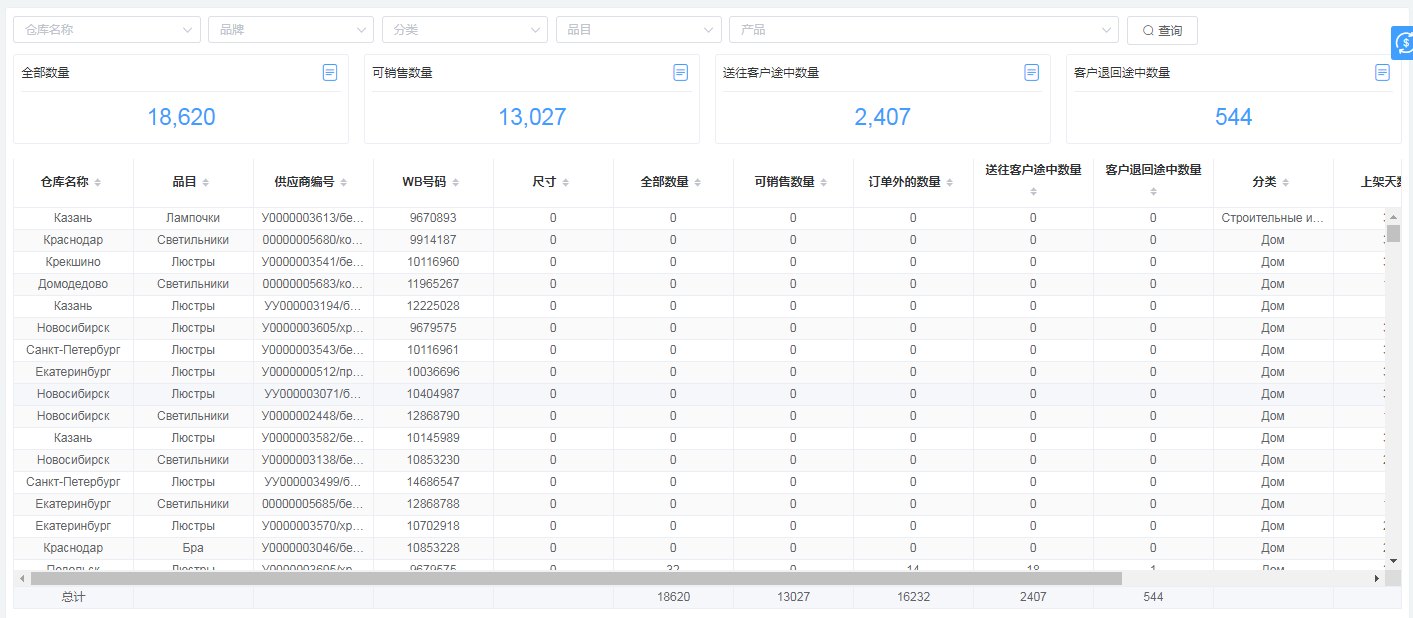
- Stock and freight. Available, in transit and returned quantities, plus freight detail and trend, so freight enters the margin conversation.
- Forecast and replenishment. The day-type model with the previous six months as stacked columns beside the forecast, and replenishment by days or by value computed from the same six-month day-type averages.
- Warnings. Slow-mover bands and storage-cost projection, computed nightly, delivered by email.
Two mechanics worth naming. Replenishment output can be edited and locked by the merchant, and locked rows are excluded from the next recomputation — the tool does not overwrite a decision a buyer has already made. And the result exports to Excel in the marketplace warehouse-zone layout, ready to import back: the last thing a merchant wants from an analytics tool is a number they must retype.
Data sync runs four feeds on scheduled tasks with retry and a tracked list of unresolved items, because silently missing data produces confident charts. Large-table queries go through Elasticsearch and pre-aggregation, and the client is only a browser.
Result
The forecast stops being a chart and becomes an order quantity that can be imported. The warning stops being a review item and becomes an email with a cost attached. Onboarding is a configuration sequence — contract, tenant, brand and warehouse setup, base data import, accounts and permissions, trial, live — rather than an installation project.
What we would not claim: that the day-type model beats a good statistical model on a marketplace that publishes seasonality. It beats it here, on this interface, with these inputs, and that scope is written into the product rather than left to the sales conversation.
Technology
| Stack | Java 8 · Tomcat · MySQL · Redis · Elasticsearch · Nginx · CentOS 7 |
|---|---|
| Delivery model | Multi-tenant SaaS, one subdomain per merchant |
| Client | Wildberries marketplace sellers |
| Status | Delivered |
Similar problem?
If this looks like something you are dealing with — a legacy system that must keep running, a workflow no product covers, an integration nobody wants to touch — send a short description. We will tell you honestly whether we are the right team, and what the first two weeks would look like.