Custom enterprise software · 2021
Oil and gas production SCADA — multi-tenant monitoring, alarms and reports
A multi-tenant SCADA platform for well production: well-site and wellhead records, device parameters, alarm handling and period reports on a dark large-screen monitoring-centre layout, plus a survey task-scheduling system built on the same base.
The situation
An oil and gas producer needed monitoring for well production and recovery: data from wells, alarms, reports, well-site and wellhead records, and device parameters, presented on a dark large-screen display in a monitoring centre. The same body of work also covers a survey task-scheduling system for a mapping customer — a different industry with the same underlying shape: master data, a process, and reports.
The tempting build for the monitoring piece is a dashboard. A screen that shows today’s figures and a few curves, written against one operator’s wells, demos well and then becomes expensive, because the next operating unit or project has different wells, different users and different reporting boundaries. A dashboard with one customer’s assumptions baked into it does not become a multi-tenant product by configuration.
The call we made
Put the tenant in the data model from the first table. Well sites, devices and users belong to an operating unit or project, and visibility and permissions follow that boundary. The monitoring screen is then a view over a tenant’s data rather than a hard-coded picture. This costs a little more at the start and is the difference between one deployment and a product that can be sold twice.
Alarms and reports are the product; the dashboard is the interface. A monitoring centre does not need to look at curves. It needs to know that a well stopped, and when. So the alarm is a first-class object — raised, acknowledged, resolved — and the report is built around the alarm as well as around production figures, so that “what happened in this period” includes both what the wells did and what the system flagged. Reports run by device and by period, because that is how operating staff actually ask for them.
Keep the device model explicit. Well-site and wellhead records, device parameters and production data are separate entities. Flattening everything into a single “data point” table makes the first screen easy and every later report painful, because the context that makes a number meaningful — which well, which device, which parameter, which period — has been thrown away.
The dark display is an environmental requirement, not a style choice. The system runs in a monitoring centre where the screen is on continuously and the room is dimmed. A white background at two in the morning is a glare problem, and the large-screen layout was designed for that setting rather than for a screenshot in a proposal.
The survey scheduling system took the same three-part shape — master data, process, reports — and was built on the same engineering base: task creation, scheduling and an execution console for field work. The domain vocabulary changes; the architecture does not. That reuse is the reason the two belong on the same page of a portfolio.
What we built
- Multi-tenant monitoring with a device and project overview as the entry screen.
- Production data capture and monitoring by well and by device.
- Alarm handling with acknowledgement and resolution, so an exception has a state rather than just a colour.
- Well-site, wellhead and device-parameter records, kept as separate entities from the data they produce.
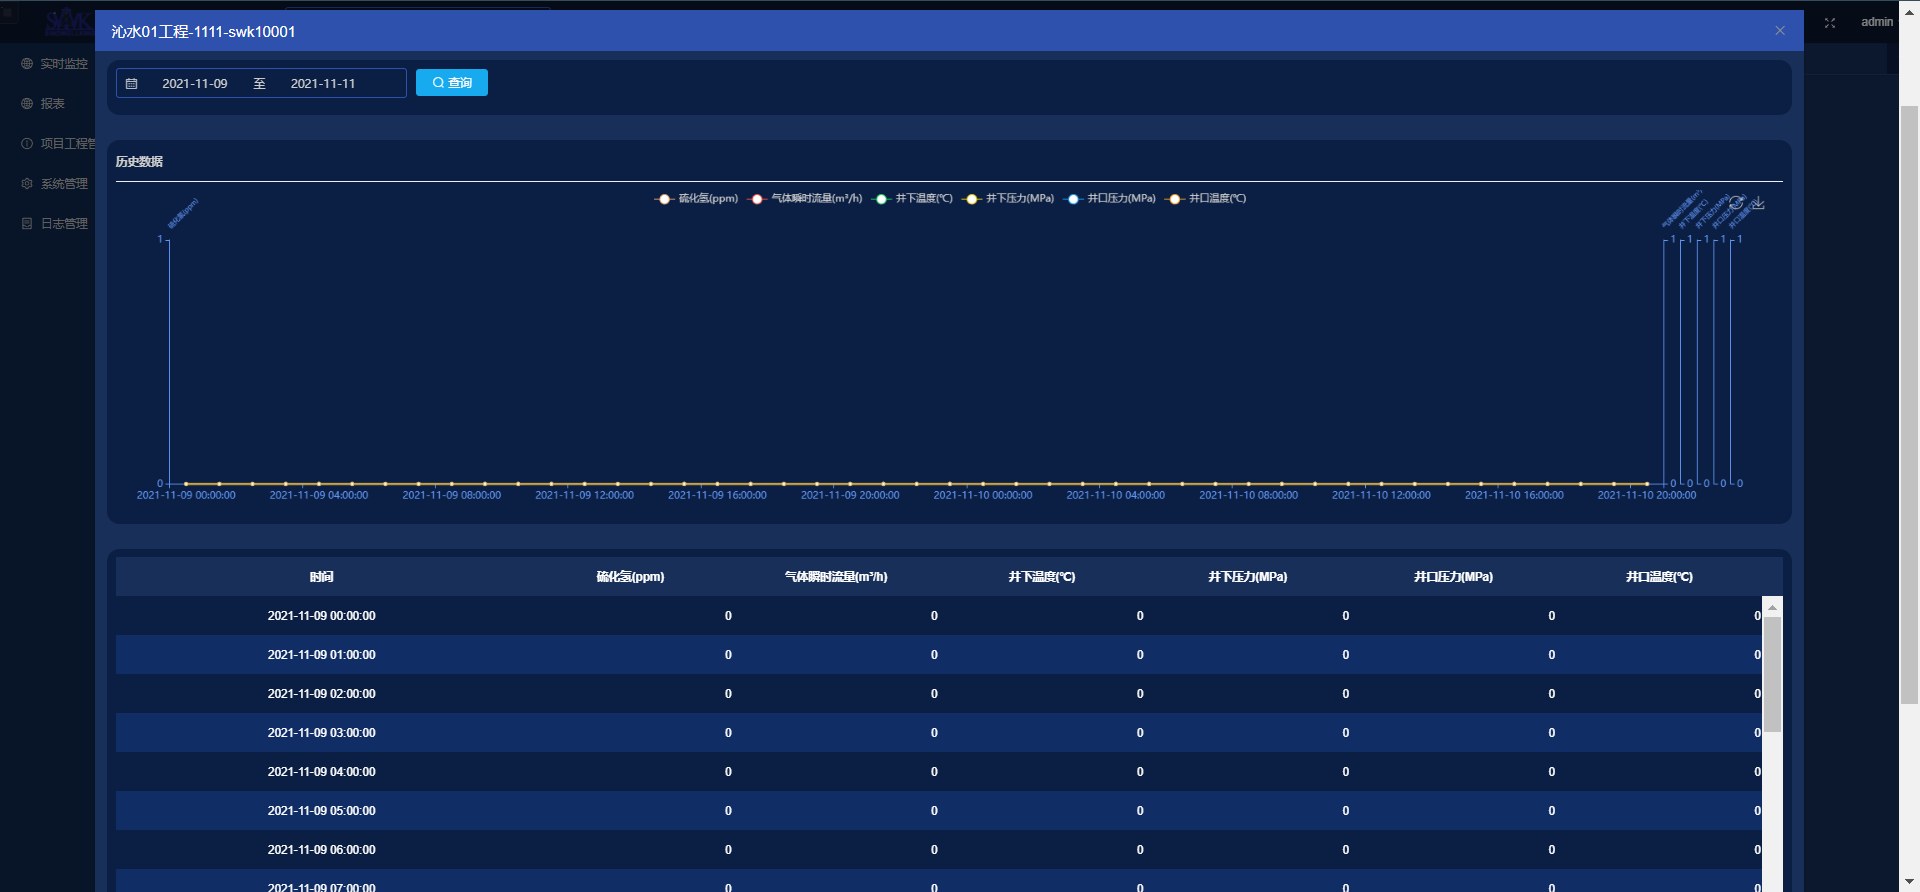
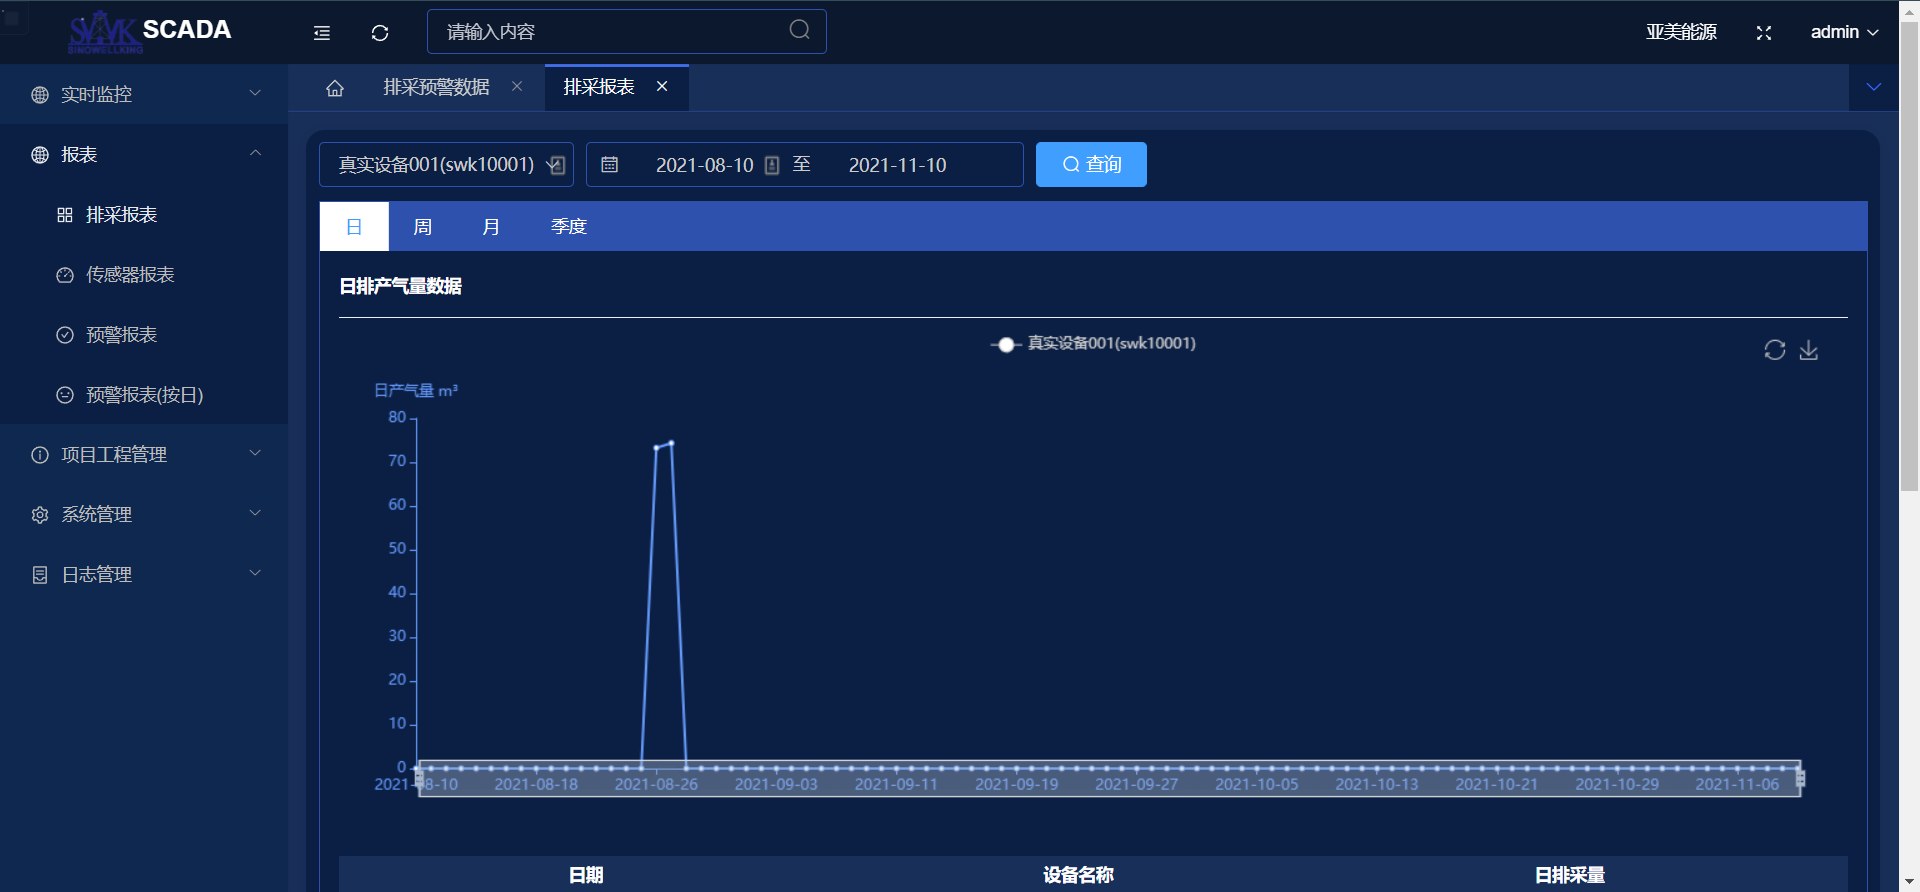
- Reports by device and period, with curves and tabular data for the same query.
- Roles and permissions scoped to the tenant, so an operating unit sees its own estate.
- Dark-theme large-screen layout for a monitoring-centre environment.
- Survey task scheduling, covering task creation, scheduling and an execution console for field teams.
Result
Operating staff see exceptions rather than dashboards, and the end-of-period report answers the question they are asked without a separate spreadsheet exercise. Because the tenant boundary sits in the model, one system serves more than one operating unit without a fork and without a second deployment.
The survey system is the clearest illustration of the working principle. A scheduling problem and a monitoring problem look unrelated, but both reduce to master data plus a process plus a report, and if those three are modelled honestly the second system is materially cheaper than the first. That is the argument for keeping the engineering base general rather than building each system to its own shape.
If you are being asked for a monitoring screen and you expect a second operating unit to use it, the question to settle first is not what the screen should look like. It is where the tenant boundary lives.
Technology
| Stack | Vue 3 · ECharts · Spring Boot · MySQL · Docker |
|---|---|
| Delivery model | On-premise delivery |
| Client | An oil and gas production operator (name withheld) |
| Status | Delivered |
What we cannot show
Well identifiers, coordinates, production volumes and alarm histories are operational data and are not published. The two views shown are from the delivered system.
Similar problem?
If this looks like something you are dealing with — a legacy system that must keep running, a workflow no product covers, an integration nobody wants to touch — send a short description. We will tell you honestly whether we are the right team, and what the first two weeks would look like.